

Understanding VMware Capacity
August 13, 2018
CMG is pleased to announce its first selected speakers for IMPACT 2019.
August 23, 2018
Author: Edward Hunter
I recently presented at the CMG CloudXchange conference on a project we’re working on at Netflix called the Magic Modem. For a good overview of what it is and what lead up to its creation I recommend watching the recording of the talk from the conference.
Unfortunately, there wasn’t time to respond to some of the questions from the audience so I’d like to do that in this blogpost. First, a bit of review.
Netflix runs on thousands of devices around the world. We wanted to understand better how the network between our servers inside AWS and the customer affected the customer experience.
We set out to instrument as much of our fleet of client devices as possible to understand how each device viewed network performance. Once we had that data we realized we could use it locally to model the behavior of any network in the world to which a customer was connected. The device we used implement the model was an off-the-shelf router running some firmware we created:
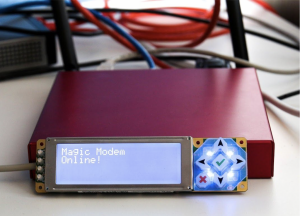 This router would sit between the engineer and the network. It could shape traffic to match the general behavior of many ISPs in the world. This had the effect of putting engineers into the same environment as our customers, where they could then experience firsthand what our customers were experiencing.
With that let me dive in to answer the questions that were posed after the talk.
Which is more informative TTR (Time to Render) or TTI (Time to Interactive)?
After analyzing the data we have settled on TTR as a good benchmark for the customer’s experience.
- Time to Interactive (TTI) is defined as the amount of time it takes to transition the app to a new state (e.g., app foregrounded or a new page) as reflected by changes in one or more process “modes” (e.g, computational power, memory allocation, …), until such time as the application is ready to receive user input.
- Time to Render (TTR) is defined as the amount of time it takes to have the target viewport (Non-Member Landing, LOLOMO, Details Page, …) fully rendered.
So for instance, you might be able to technically interact with a page even though it is not fully rendered. This may not be obvious to the customer, and consequently, the measurement would not tell you a lot about the customer experience. Additionally, there was general agreement internally on how to measure TTR which allowed for easier comparisons between devices.
Is there a threshold where the number of samples from a class of device is too small?
In any single network or device you need a number of samples which is statistically significant for comparison with other devices. Our dashboards allow us to adjust for how many samples we want to display for. Generally, for devices we’re looking for at least ten thousand samples. That being said smaller sample sizes may still yield useful data under certain circumstances.
Did the banding in the Daedalus data reveal anything interesting?
Yes, we can learn several things from visualizing the client data. First, we can see that networks in different regions have different latency patterns that vary over time. Look at a network DNS time in the U.S. shown below. Shorter request times are at the top of the chart. The deeper the color of the cell the more requests fall in that bucket:
Compare this to a network outside the U.S.
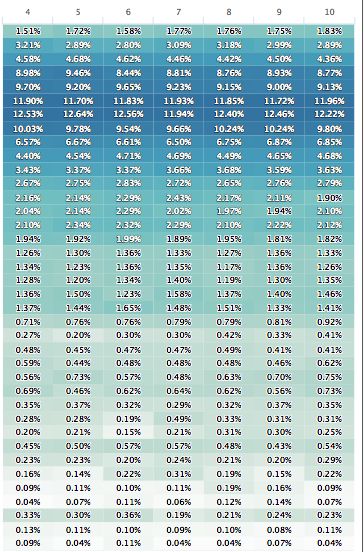
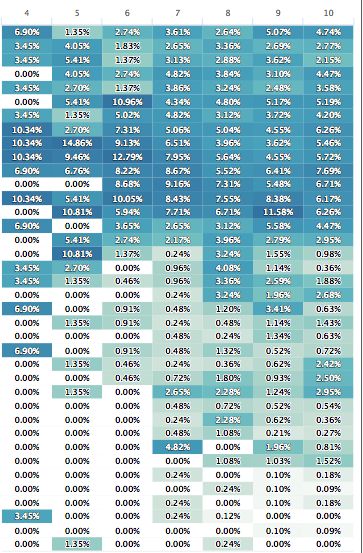 The U.S. based network is much most consistent over time. We can see that just using averages though would hide some of the outliers we see in the non-U.S. region. That might lead to some incorrect conclusions about the user experience in those regions.
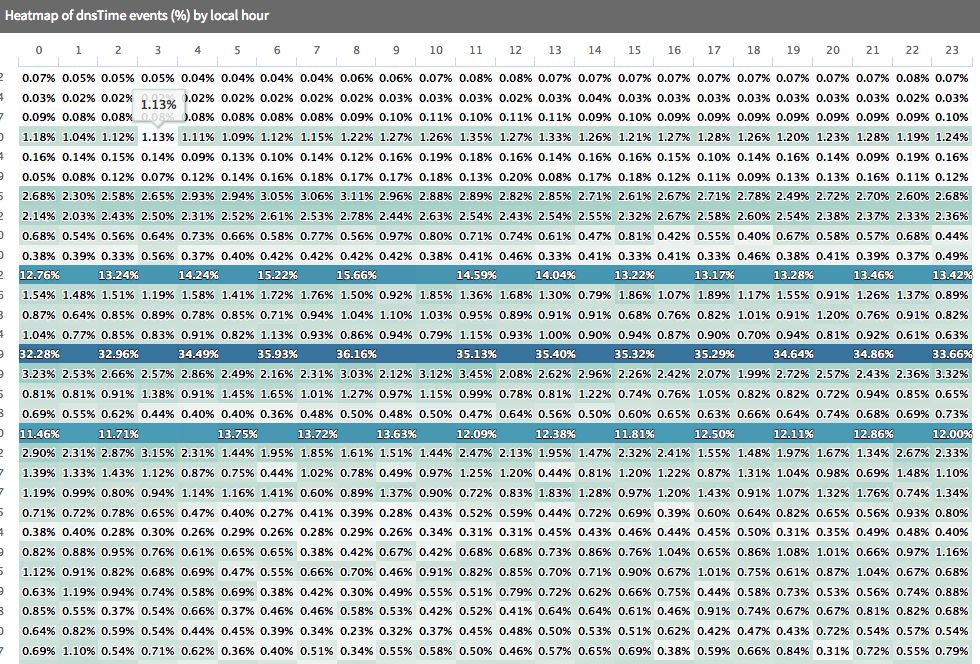
Another example is looking at DNS times for requests that don’t hit the local cache on the device. Below is a view of all PS4’s in the U.S. The banding here indicates responses from different DNS resolvers. It points to a potential opportunity for optimization based on the provider you choose. This could be an area for further digging.
Are you concerned about memory utilization on the device to collect data?
We worked to keep the memory utilization has flat as possible. That’s what lead to the histogram bucket approach for collecting the data. We were looking for mechanism that would have a small memory footprint and would not increase over time with use.
Is the magic modem available outside of Netflix ?
We have plans to open source the design later this year. Here is a link to a blog post from one of the engineers on the project that walks through one strategy to get a similar result. This is from a talk given at Facebook earlier this year. The open sourced version should smooth out the rough edges and make it easier to use.
Conclusion
At this point we have deployed about 50 of the routers in house for use by different engineering teams and the general feedback is very positive. As I mentioned in the talk we continue to tweak our algorithms to make the models we use more accurate and we’re investigating new use cases such as being able to model a day’s worth of network latency in a short period of time. Stay tuned for updates on what we find.


