
Observability: Challenges and Opportunities
May 17, 2021
AIOps for Data Center Resiliency – Dan Wiegand, IBM
May 27, 2021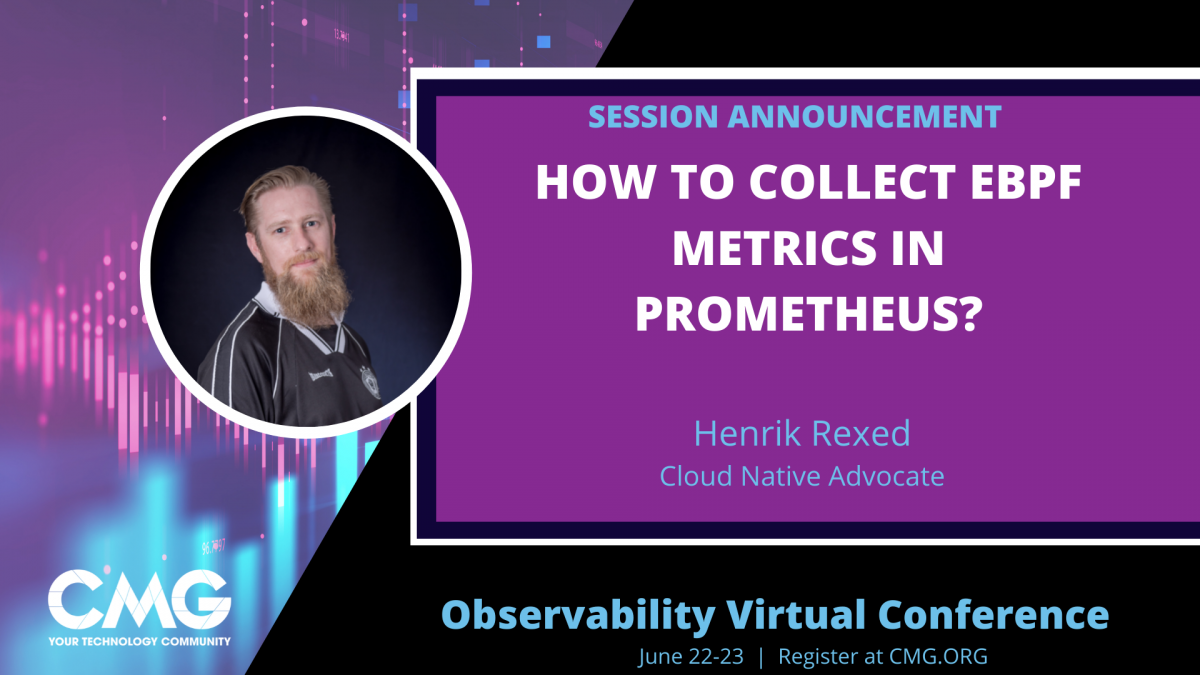
Abstract:
Prometheus has become THE standard for collecting observability metrics in Kubernetes and cloud-native environments. Prometheus sheds light on the inner workings of Kubernetes clusters and workloads by supporting a vast number of technologies. Lots of Kpi (CPU, IO, network. Etc) in our On Premise environment are less precise when we start to work on Cloud environment.
Ebpf is the perfect technology to understand precisely what is really happening at the kernel level.
In 2018 CloudFlare shared an opensource project to expose custom ebpf metrics in Prometheus.
During this presentation, Henrik will explain:
- What is ebpf?
- What type of metrics we are able to collect?
- How to expose those metrics in a K8s environment.
This session will try to deliver a step-by-step guide on how to take advantage of the ebpf exporter.
Make sure to bring your questions as we will conclude with live Q&A
About the Speaker:
Henrik is a Cloud Native Advocate at Dynatrace, the leading Observability platform. Prior to Dynatrace, Henrik has worked as a Partner Solution Evangelist at Neotys, delivering webinars, building protypes to enhance the capability of NeoLoad. He has been working in the performance world more than 15 years, delivering projects in all contexts including extremely large Cloud testing on the most demanding business areas such as trading applications, Video on Demand, sports websites, etc. Henrik Rexed Is Also one of the Organizer of the Conference named Performance Advisory Council.
To view the video you must have a CMG membership or have a virtual conference registration. Sign up today!
For existing members sign in here.

