
Digital Transformation Panel Discussion – Executive Insights 2018 Tampa
January 23, 2019
What to do when Machines do Everything
January 30, 2019
By Richard Gimarc ([email protected])
CMG is the sum of the people who contribute. This is true for most organizations and is especially true for CMG. In this blog we look at the results from text mining the contributions made to the 40+ annual CMG conferences starting in 1976. This is a continuation of the October 9 blog I wrote: “Text Mining the CMG Archives.”
As a quick preview, two surprising results: over 2,500 individuals contributed to the annual conference from 35 countries.
Questions that we will answer are:
- What can we learn about the individual contributors?
- Where have these contributors come from?
- How can we use this information to grow CMG?
The two primary metrics used in this analysis were:
- Individual contributor – This is the set of authors listed on the papers and presentations. Author names have been standardized. For example, my name appears both with and without a middle initial. The middle initial was dropped to standardize my name. For each contributor, we also determined their country (yes, this required several Google and LinkedIn searches).
- Individual contributions – This is the total number of contributions by the authors. For each paper or presentation contributed to the conference an author gets a +1.0
Counting rules: We only included papers/presentations from each annual conference.
- Papers and presentations are counted if a PDF was included in the conference proceedings.
- Pre-conference workshops are not included in the count.
- Each CMG-T tutorial is counted as +1. If a tutorial has 3 parts, then it is counted as +1 (instead of +3).
The table below shows the high-level summary counts. The large number of contributors and contributions to the annual CMG conference is impressive.
| Total papers/presentations | 3,924 |
| Number of individual contributors (people) | 2,527 |
| Total individual contributions | 5,437 |
| Number of countries represented | 35 |
During the collection and preparation of the data, I noticed a couple of interesting titles:
| Shortest title | “8½”
Two characters. 1993 paper by James McGilliard at FEDSIM. The title is a reference to a 1963 movie by Federico Fellini. It made me think of train platform 9¾ in London’s King’s Cross Station (yes, this is a Harry Potter reference). |
| Longest title | “Performance Measurements and Post Data Reduction: Using Radview WebLOAD and Analytics to Load Test the Georgia Tech Research Institute Research Portal Web Site in a Linux Environment”
182 characters. 2014 paper by James Logan at the Georgia Institute of Technology. |
Our analysis starts by looking at CMG’s individual contributors. The following table lists the Top 10 individual contributors. Not only are these the top contributors of conference content, they are also the people who helped build CMG’s reputation as the premier organization focused on evaluating and planning for the performance and capacity of today’s applications and environments.
| Individual Contributor | Contribution Count |
| Bernie Domanski | 43 |
| Connie U. Smith | 43 |
| Jeffrey P. Buzen | 38 |
| H. Pat Artis | 37 |
| Michael Salsburg | 37 |
| Yiping Ding | 37 |
| Daniel A. Menascé | 35 |
| Bruce McNutt | 33 |
| T. Leo Lo | 31 |
| Mark Friedman | 30 |
Another way to view individual contributors is how often they contributed to the conference. The following chart shows the number of “N-Timer” contributions per year.
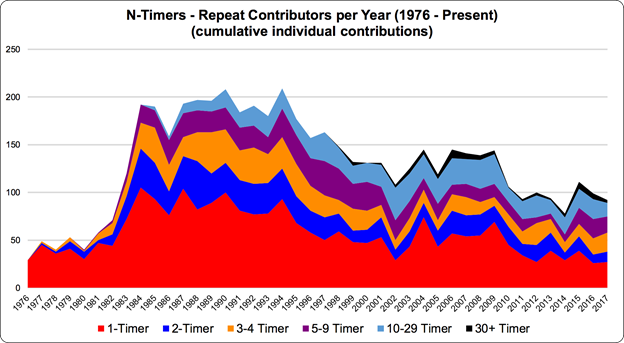
An “N-Timer” is someone who has made N contributions to the annual conference. The set of “N-Timers” changes for each succeeding year of the conference:
- At the first conference in 1976, there were 29 “1-Timers”; everyone was making their first contribution to the annual conference. This is our starting point.
- Next year, 1977, there were 49 contributions: 45 were making their first contribution (“1-Timers”), two were making their second contribution (”2-Timers), and one was making their second and third contributions (our first “3-Timer”).
Consider the shape of layers in the chart. The “1-Timers” (red) are the largest. Over time, “1-Timers” graduate into higher layers as they make additional contributions, but we have a healthy number of new individuals taking their place. What is interesting is the “10-29 Timer” layer. These individuals have made significant contributions to CMG, and the size of this layer is reasonably consistent since 2000 (about 20%). And finally, you can see the chart topped by the 30+ N-Timers; these are the same individuals listed in the previous Top-10 list—the frosting on our layer cake.
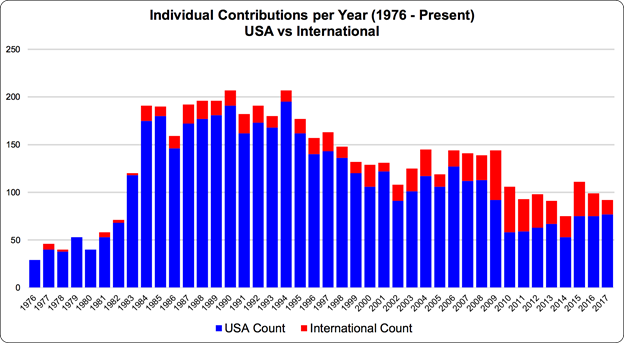
Next, we look at where the contributors come from. The following chart shows the total number of individual USA and international contributions for each year. Note the increase in international contributions (red bars). It’s clear that CMG’s international flavor is increasing.
To get a better understanding of the breadth of CMG’s international community, the following chart shows the number of individual contributions per country (excluding the USA). Countries are listed in descending contribution order, which means that Canada and India had the most contributions.
To get a better understanding of the breadth of CMG’s international community, the following chart shows the number of individual contributions per country (excluding the USA). Countries are listed in descending contribution order, which means that Canada and India had the most contributions.
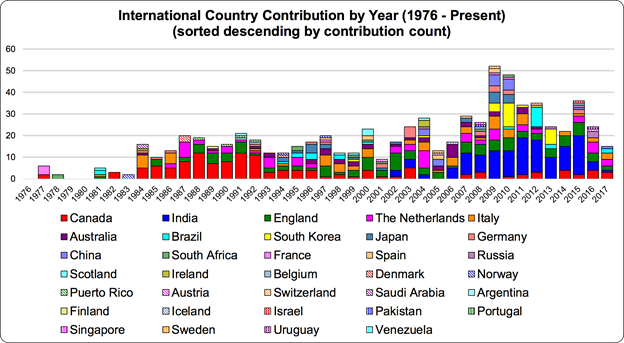
The top three contributing countries are Canada, India and England (listed first in the legend). It’s remarkable to see the wide range of countries represented. This chart highlights the international participation in CMG.
Finally, we’ll look at recent contributions from the last 10 years starting in 2008. The reason for doing this is that recent activity should serve as a future predictor.
Since 2008 we’ve had:
- Total of 730 papers/presentations, an average of 73 paper/presentations per year
- 556 individual contributors
- Total of 1,048 individual contributions; 732 from the USA and 316 international
The chart below shows three individual contributor counts: USA, international, and a 1-time contributor.
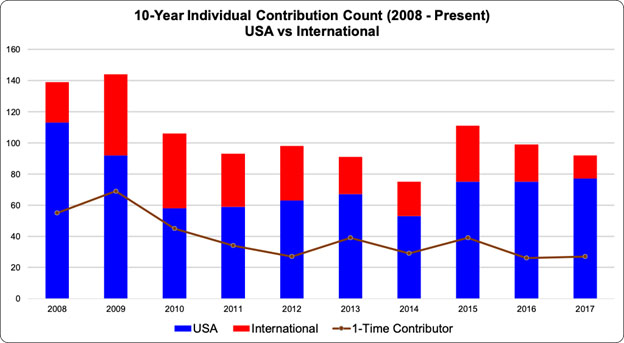
Since 2010, the individual contribution count has been fairly steady (approximately 100 per year) with about 30% from international sources. Also, look at the “1-Time Contributor” line. These are the individual contributors that only had a single contribution during the last 10 years. Since 2010, that count averages about 33. The question for us: how do we get these 1-timers to return?
Our last bit of digging is to look at the Top 10 individual contributors for the same 10-year period. It’s interesting and encouraging to note that two of our recent Top 10 contributors—Menascé and Salsburg—are also in the overall Top 10 List. This table shows that there is a new and growing generation of CMG contributors.
| Individual Contributor | Contribution Count 2008 – Present |
| Glenn Anderson | 22 |
| Alexander Podelko | 14 |
| Daniel A. Menascé (*) | 14 |
| Denise Kalm | 14 |
| Michael Salsburg (*) | 14 |
| Peter Johnson | 13 |
| Richard Gimarc | 13 |
| Gilbert Houtekamer | 11 |
| Manoj Nambiar | 11 |
| Scott Chapman | 10 |
What have we learned?
CMG is clearly an international organization with contributors from the USA and 34 other countries. A large number of individuals have helped build CMG’s reputation and success: over 2,500 individual contributors and over 5,400 total contributions.
Restricting our view to the last 10 years we’ve had over 500 individual contributors who are credited with over 1,000 contributions. These numbers have been relatively steady since 2010. We also saw that there were several 1-time contributors. We need to find a way to encourage these individuals to return to CMG—think about the advantage of compound versus simple interest.
CMG’s success is due to contributions from the CMG community. This was true during CMG’s formative years and is still true today. As an organization, we need to find ways to recognize, encourage, energize and expand our community of CMG contributors.
And finally, I’m reminded of Charlton Heston’s iconic line in the 1973 movie, Solyent Green, “It’s people. Soylent Green is made out of people!” For us “It’s people. CMG is made out of people!”
