
CMG-Computer Measurement Group seeks talented Managing Director to lead into new phase of excellence
May 2, 2016Better Information from Better Data Visualization – MeasureIT 16.1
May 8, 2016Published Spring 2016 in MeasureIT 16.1
By Murthuha Shaik (Infosys, Hyderabad) and Madhu Tanikella (Infosys, Hyderabad)
Abstract
For one of the enterprise applications hosted on a cluster of IIS servers, very high CPU utilization was observed for a business process, even when there were no requests to be serviced. Analysis of performance counters such as CPU, Memory or Paging on the IIS servers did not reveal any clue for the high CPU utilization issue. In this article, I would like to describe a simple but effective technique for analyzing an IIS crash dump using the Debug Diagnostic Tool that helped in the deep-dive analysis of the IIS W3WP process to identify the root-cause for high CPU utilization in a quick and effective way.
____
To continue reading, you must have a CMG membership. Sign up today!For existing members sign in here.
Introduction
As part of the performance tuning exercise for a business critical application developed and maintained by a Manufacturing Giant in USA, a Load Test was carried out in the Performance Test Environment (PTE) to understand the performance characteristics under Peak Load. The application architecture has 5 IIS servers load balanced through 3 DNS, 1 database server and few other applications as integration points. During the Load Test, it is observed that the W3WP process was utilizing 100% of all the available CPUs continuously on one particular IIS server when all 5 of the IIS servers were being hit at the peak concurrent user load. As soon as 100% CPU utilization was observed on one of the IIS servers the test was stopped; however, the IIS server at 100% CPU utilization continued even after the ending the Load Test (i.e., when no more requests were being sent from the load testing tool), while the other 4 IIS instances were fine.
To identify the root cause of the issue, we captured and analyzed IIS access logs, error logs, Web Service logs, and Windows events on the specific IIS server; however, we could not find any evidence for the high CPU utilization issue. As a last resort, we decided to capture a Thread / Crash dump of the IIS Server process so as to understand the state of its threads and if any specific thread was causing the CPU to be continuously at 100%.
Hence, the same Peak Load Test was repeated and the Thread Dump / Crash Dump data was captured from the IIS server that had 100% CPU utilization during and after the Load Test. We initially started analyzing the dump file with the help of windbg; however, that task was time consuming since considerable manual effort was required to setup symbols and use those symbols. Hence, explored for alternate tools that could help analyze an IIS Crash Dump/Thread dump quickly and efficiently and found the Debug Diagnostic Tool (DebugDiag) from Microsoft which can quickly pin-point thread level details in a Crash Dump / Thread Dump. In the next section, we introduce the DebugDiag tool and the various options that are available for analysis and the steps to follow to analyze a given Thread/Crash Dump from an IIS server so that the root-cause for very high CPU Utilization issues can be uncovered quickly and effectively.
Debug Diagnostic (DebugDiag) – How to Use Effectively
The Debug Diagnostic Tool (DebugDiag) is designed to assist in troubleshooting issues such as hangs, slow performance, memory leaks or fragmentation, and crashes in any user-mode process. The tool includes additional debugging scripts focused on Internet Information Services (IIS) applications, web data access components, COM+ and related Microsoft technologies [1].
The Debug Diagnostic Tool comes with the following 3 analyzer components along with a set of built-in rules:
1) Crash / Hang Analyzers
√ CrashHangAnalysis
√ SharePointAnalysis
2) Memory Pressure Analyzers
√ DotNetMemoryAnalysis
√ MemoryAnalysis
3) Performance Analyzers
√ PerfAnalysis
Since the current problem was to find the root-cause for high CPU Utilization on an IIS server, Performance Analyzer and its PerfAnlaysis component was used. Here, we would like to highlight the process of setting up the tool and how to use it for a given W3WP Thread/Crash Dump to uncover the root-cause quickly and effectively
- Download and install the Debug Diagnostic Tool v2.0 from Microsoft WebSite [1].
- Make sure you generate the Crash/Thread Dump from the required IIS server or get it from the respective Admin team.
- Export and place the W3WP Crash/Thread Dump in an accessible location for the DebugDiag tool
- Invoke the DebugDiag tool from your local system (refer to Figure1. For the landing page of DebugDiag tool).
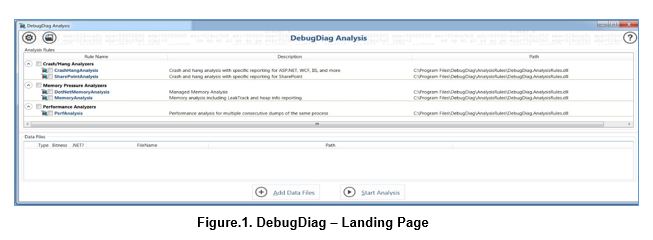
- Click on ‘Add Data Files’ and add your W3WP process dump file to the DebugDiag tools data files repository.
- Click on ‘Start Analysis’ and wait for some time (time taken depends on the size of the crash dump file or the number of files which needs to be analyzed). It is suggested that you capture and analyze a minimum of 3 to 4 crash dumps to get an accurate status of the IIS server when the issue happened.
- After completion of the analysis an output MHTML file is generated at the default location
‘C:\Users\<UserName>\Documents\DebugDiag\Reports\<FileName>.mht’ - Analyze the .mht file to identify the thread status and eventually the root-cause of the issue
Here, we would like to highlight the key aspects that need to be looked at in the report generated by the tool to identify the root cause for high CPU Utilization issues (refer to Figure.2)
- Top 5 Threads by CPU Time
- # of Threads in Running condition
- Thread Ids of Running Threads
- CPU Time for each of Running Thread
- Thread Entry Point
Analyzing the above key aspects and correlating them helped to uncover the single service (note there are around 40 services running in this one W3WP process) which was causing 100% CPU utilization on the IIS server.
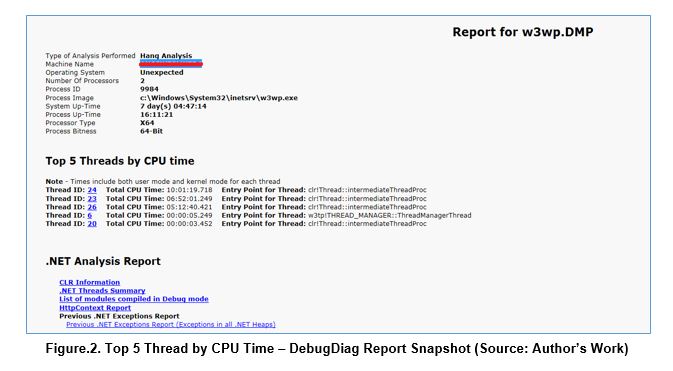
- Thread numbers 24, 23 and 26 are easily identified as long running threads in the system.
- Thread 24 has been running for over 10 hours and it is still running – it did not die for a particular service.
- Threads 23, 24 and 26– the 3 high CPU consuming threads belong to the same service.
- Threads 6 and 20 do not have a large CPU time – they are each running for less than 6 seconds – hence, they do not attribute to the high CPU usage.
- The problematic service name and its stack trace is provided by the DebugDiag and helped in addressing the issue with the help of development team.
Summary/Conclusion
Analyzing a Crash/Thread dump of the W3WP process of IIS Server to identify root-cause for high CPU issues is tedious; but using the Debug Diagnostic Tool helps you pin-point specific thread level details quickly and effectively. The tool helps in reducing turn-around time to identify the root-cause for performance issues such as 100% CPU utilization, very high response time, hung threads, and memory issues for multiple .NET components/applications/services hosted on IIS server.
References
- http://www.microsoft.com/en-in/download/details.aspx?id=26798
- http://www.iis.net/learn/troubleshoot/performance-issues/troubleshooting-high-cpu-in-an-iis-7x-application-pool
About the Authors
Murthuja Shaik is working as a Senior Technical Architect at Infosys, Hyderabad. He has 18+ years of experience in software development, performance testing and engineering. His core expertise is in Performance and Scalability Assessment of applications ranging from client/server to Web-based to Enterprise Distributed systems, Performance Bottleneck Identification, Performance Tuning, Suggesting Tuning Solutions, Setting up PE CoEs for clients in domains such as Financial Services, Insurance, Manufacturing, Retail, Healthcare. Murthuja can be reached at [email protected]
Madhu Tanikella is a Senior Technology Architect at Infosys, Hyderabad. He has 14+ years of experience in providing delivery and consulting services in Performance Engineering & Performance Tuning for enterprise software systems that fall under client-server, multi-tier (Java/J2EE), SOA, Messaging Middleware architectures, Virtualization and Cloud models and custom-built applications with multiple COTS products. He has specialized expertise in the areas of NFR & SLA Validation, Workload Modeling, Performance Modeling, Bottleneck Identification and Performance Tuning (of Java/J2EE, Oracle DB, TIBCO Business Works and IBM MQ), Capacity Planning, Hardware Assessment and Sizing for distributed software systems. He also has expertise in assessing performance practices in an organization and setting up Performance Engineering CoEs for various clients in different Domains such as Financial Services, Manufacturing, Insurance, Healthcare, Retail etc. Madhu Tanikella is certified in IBM Cloud Computing Architecture and IBM SOA Solution Designer. He can be reached at [email protected]
/mepr-show]