
Demystifying Performance Assessments in Scaled Down Environments
CMG imPACt 2017 – Call for Papers
March 13, 2017Tree-map / Heat-chart / Tile chart is good for the data analysis visualization/dash-boarding
March 28, 2017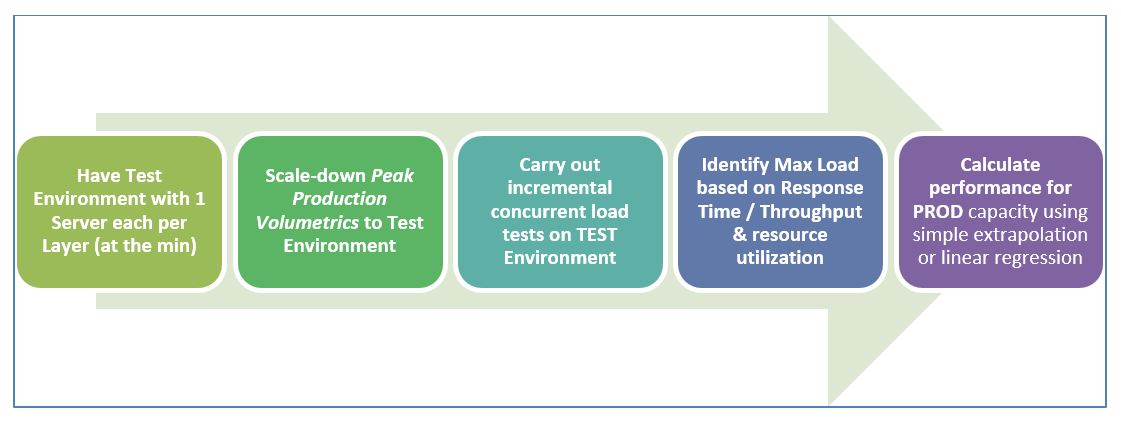
Many a times, I came across typical questions from various clients regarding application performance assessments and validation: “we have 30% scaled-down version of production for an enterprise application and how can you benchmark application performance? How can you peruse these results and predict performance for production hardware and provide performance sign-off?”
In my view, it’s quite a common scenario faced by Managers, SMEs, Architects and QA teams involved in providing application performance services – be it plain vanilla performance testing or comprehensive Performance Engineering (PE) services. Performance Modeling is one of the approaches that can help address such scenarios, however, it takes significant time to create and it becomes more complex to implement for distributed enterprise IT applications due to multiple processing layers, 3rd party systems, varying data and so on. Also, Performance Modeling requires mathematical/analytical modeling supported with more data points for accurate prediction. On the other hand, the idealistic approach is to get a PROD-like hardware in all layers, which is expensive and has high lead time to procure required hardware, in order to carry out performance benchmarking and provide sign-off.
In this whitepaper, I would like to share and suggest a simple but powerful approach that is based on performance engineering concepts such as ‘knee point’, ‘hardware capacity saturation’ and ‘Horizontal Scalability’ in specific. It helps solve the problem at hand in a more practical and convincing way as it’s cost-effective, simple and easy-to-implement for a given enterprise IT system.
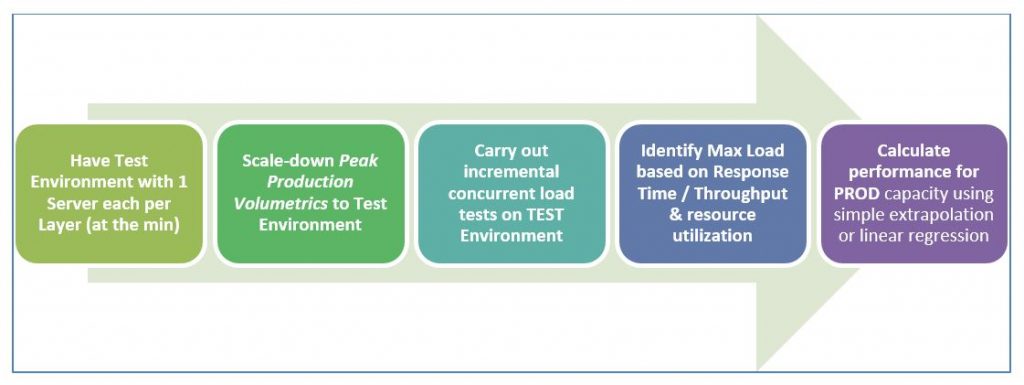
- Have a Test Environment with just 1 server in each layer – be it WebServer, Application Server, DB Server or Messaging Middleware and any other component required for the business processes considered for performance benchmarking.
- For instance, if PROD has 4 webservers, 4 Application Servers and 1 DB server, try to create Test environment with 1 Web, 1 App and 1 DB server (which is ~1/16th of PROD capacity)
- Scale-down Peak Production Volumetrics to your Test Environment, based on the % scaled-down factor w.r.t hardware capacity of PROD Vs TEST. This will be the Peak Volumetrics for TEST – g. if Peak Load anticipated in PROD for 5 Application Server is 1000, the Peak Load for TEST with 1 Application Server is ~200
- Carry out incremental concurrent user load tests (such as 10, 20, 30, 50, 100 users) with the key objective of finding out the maximum concurrent load that can be supported by this scaled-down TEST environment.
- Max User/Transaction load supported by the application can be decided based on the Load at which degradation in Response Time or Throughput noticed or MAX Capacity Utilization reaches for one of the hardware resources (i.e., CPU / Memory / DISK) in any one of the servers across the layers, which in turn causes application performance degradation thereafter.
- For instance, DB CPU is ~95% continuously for 30 user load whereas Web & App Server layers are still at ~50% & 60% of CPU usage – it indicates that Max User load that can be supported is ~30 users. Any further increase beyond 30 user load starts showing degrading response time or throughput as DB’s CPU utilization hits maximum
- The key is to highlight that any single server with given hardware (such as CPU and RAM) cannot support beyond a certain user/transaction load and it represents the ‘knee point’, post which performance starts degrading which is not acceptable.
- In such scenarios, one of the ways to support more load is to add more such servers in parallel and create a cluster which represents ‘Horizontal Scalability’ (alternately, more CPU/Memory can be added to the same server which represents Vertical Scalability and is not relevant to this blog)
- Hence, based on the application ‘knee point’ or ‘Max User/Transaction load’ supported in TEST environment, performance numbers for PROD Capacity can be calculated using simple extrapolation or linear regression. Alternately, the required number of servers in PROD can also be calculated and verified.
- Since simple extrapolation results work better with predictions derive based on ‘horizontal scaling approach’ as each server’s processing is limited by its hardware capacity and no hardware contention comes in effect with more servers in a cluster. Besides, Horizontal Scalability works fine for Webserver, AppServer, Messaging Middleware layers as they can be clustered easily to realize benefits of multiple servers running in parallel.
Real-world scenario
Let’s take a look at the outcome of implementing the above-mentioned Approach for an enterprise level Client-Server application in one of the largest Financial Services firm in USA. The application aims to automate paper-based processing of various documents required by enterprises to carry out financial transactions. The application is implemented using a COTS product supporting Optical Character Recognition (OCR) technology that extracts data from various documents that will be further validated by internal users thru CITRIX interface. Due to business criticality, management wanted to have a performance baseline of this application, however, there is no environment that matches PRODUCTION configuration (i.e., number of servers and hardware capacity) that can be used for performance testing except their QA environment which is a scaled-down environment. (Refer to Table.1)
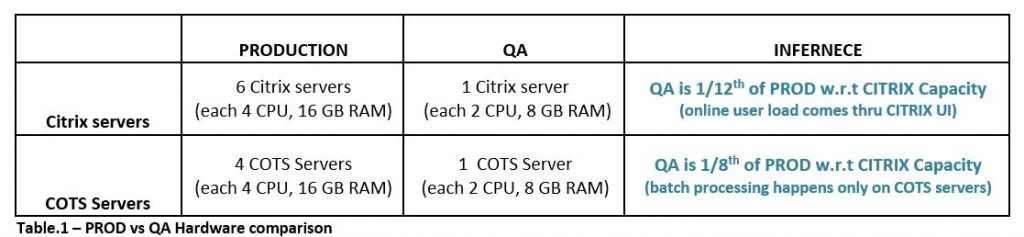
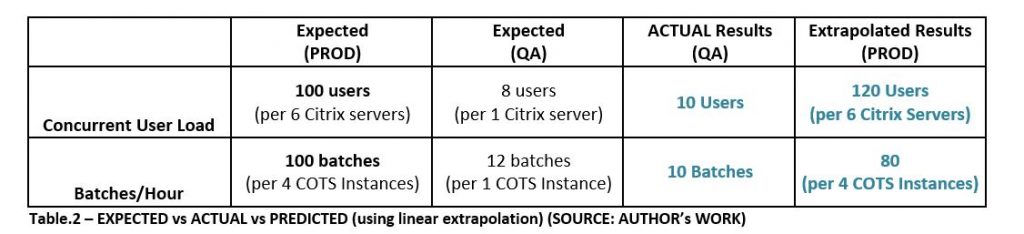
The application is expected to have peak load of 100 concurrent users accessing the application thru CITRIX UI and a batch throughput of 100 batches/hour, hence performance validation is required for these 2 non-functional requirements – Concurrent User Load & Batch Throughput.
In order to find out Max User Load that can be supported by given QA environment, carried out an incremental concurrent user load tests (4, 8 and 12 concurrent user load) for UI functionalities while the batch processing takes place in parallel, in order to mimic production scenario.
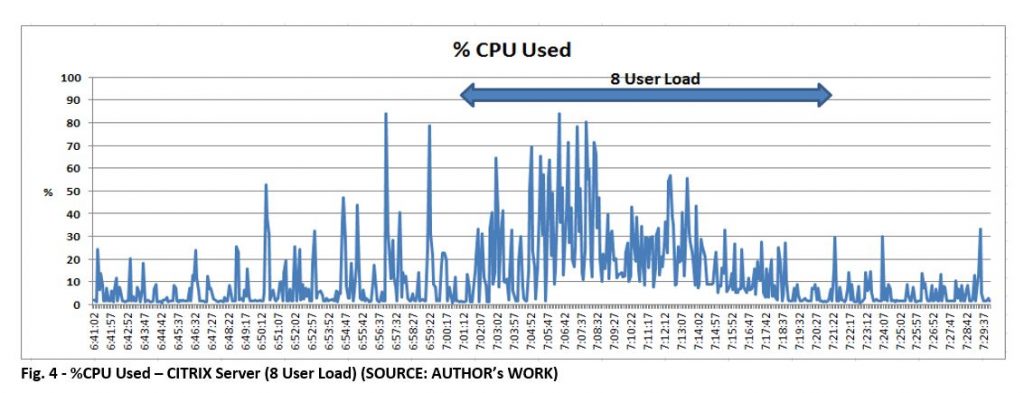
At 12 concurrent user load, observed 100% CPU Utilization on CITRIX Server whereas CPU usage on COTS server ranges 60% – 100% for the 10 min duration where all 12 users are active. Besides, the UI response time started degrading from 8 user load to 12 user load as shown in Fig.1 and Fig.2 below. CPU usage on CITRIX servers for 8 user load is ~60%.
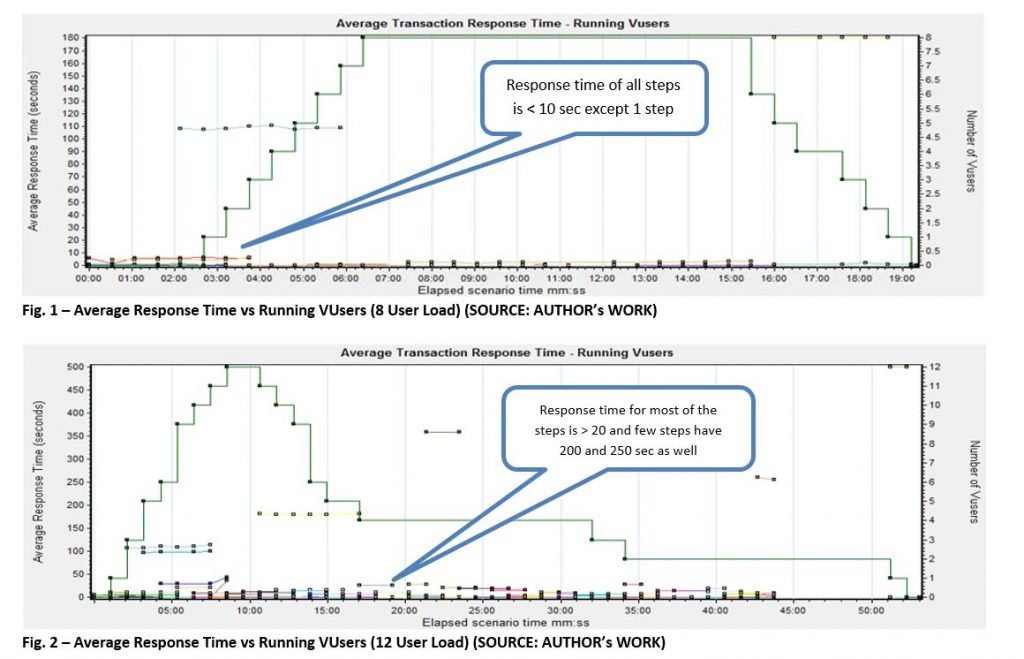
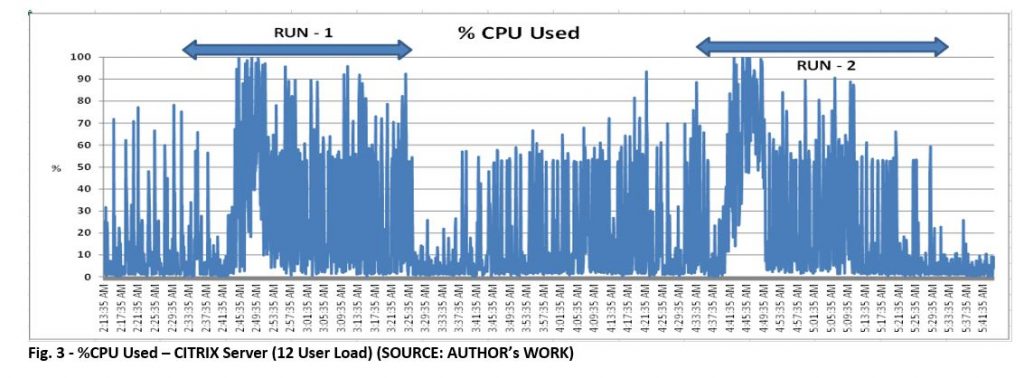
Overall, 1 CITRIX and 1 COTS server in QA can support max of 10 concurrent user load with 10 Batches/hour as CPU utilization on both servers reached 100% when all 12 users are concurrently working and 2 users failed.
Linear extrapolation of test results to PRODCUTION capacity indicates that PROD can support 120 concurrent users with 80 batches/hour (refer to Table.2) which is close to the defined NFRs of this application. Once the application went live, Production Support who take care of production operations confirmed that ~100 end-users are currently accessing the application thru CITRIX interface and they have not heard of any performance issues from the users.
Having said that, let’s take a look the benefits and challenges of implementing this approach.
Benefits
- No need to wait till the full PROD-LIKE hardware capacity is acquired for performance benchmarking and hence helps gain early visibility about application performance (i.e., response time, throughput, max load and capacity saturation)
- The extrapolation numbers derived from scaled-down environment for PROD hardware capacity helps understand the performance risk early – which is better off to deal with rather than not having any data points in the absence of a full prod-like environment
- The approach does not demand any additional commercial tools or complex techniques and hence it’s cost-effective and easy to implement.
- If PROD has ‘n’ servers each in Web, Application and Database server layers, the TEST environment requires 1 server minimum to gain insights of application performance – this reduces the hardware procurement cost by 1/nth and still gain insights with acceptable deviations – However, this approach is not a replacement for performance benchmarking using a prod-like environment.
Challenges
While this approach is definitely helpful to have early insights about application performance and capacity needs, there are few challenges that should be kept in mind as well:
- In cases where a single server in PROD has high end configuration such as 8 or 16 or 32 CPUs, it’s a challenge to get even 1 server of same capacity in TEST. In such cases, the only option is to go for a server with lesser hardware capacity (i.e., 1/4th or 1/8th) in TEST and proceed with extrapolation even for ‘vertical scaling’ – however, the major challenge is to deal with linear extrapolation of performance results which will not be as accurate, since factors such as cache contention, coherence etc. will come into effect for vertical scaling unlike in horizontal scaling. This can only be addressed using Analytical Models (AM) where performance data should be captured for incremental CPU count (i.e., 1, 2, 4, 6 and 8 etc.) and predict the performance behavior.
- Clustering at Database layer is not straightforward unlike in Web/App/Middleware servers – however, it can be addressed using technologies such as Oracle Real Application Clustering or SQL Server Clustering where multiple server nodes act as single DB instance.
Conclusion
To conclude, performance benchmarking and providing sign-off for applications in scaled-down environments has its own challenges to deal with – by embracing a simple and effective approach based on core performance engineering principles such as ‘application knee point’ and ‘horizontal scalability’ helps gain early insights of application performance instead of waiting till a PROD-like environment is created. Note that this approach is not a replacement to carrying out performance benchmarking on prod-like environments rather an alternative and effective approach to gauge application performance early in the game. After all, for business and IT teams, proactive information with actionable insights is the key to manage application performance effectively!!
About the Author
Madhu Tanikella is a Senior Technology Architect at Infosys, Hyderabad. He has 15+ years of experience in providing delivery and consulting services in Performance Engineering & Performance Tuning for enterprise software systems that fall under client-server, multi-tier (Java/J2EE), SOA, Messaging Middleware architectures, Virtualization and Cloud models and custom-built applications with multiple COTS products. He has specialized expertise in the areas of NFR & SLA Validation, Workload Modeling, Performance Modeling, Bottleneck Identification and Performance Tuning (of Java/J2EE, Oracle DB, TIBCO Business Works and IBM MQ), Capacity Planning, Hardware Assessment and Sizing for distributed software systems. He also has expertise in assessing performance practices in an organization and setting up Performance Engineering CoEs for various clients in different Domains such as Financial Services, Manufacturing, Insurance, Healthcare, Retail etc. Madhu Tanikella is certified in IBM Cloud Computing Architecture and IBM SOA Solution Designer. He can be reached at [email protected]


